In this post we are going to see how we can add diagrams to our readme files inside GitHub.
For the last few years, Github have support for different syntaxes inside markdown files to create diagrams and this is huge!
Not only flowcharts, which we usually use when designing systems, but also geolocation and 3D models.
Table of contents
1 - Create diagrams on GitHub
To create diagrams we will use the mermaid library, which has extensive documentation on how to make these diagrams and what types it supports
Among them we can find flowcharts, sequence diagrams, class diagrams, git graph trees or even entity relationship diagrams.
To enable these diagrams we must create a code block in our markdown file and specify mermaid as the language indicator.
We already know that when we write code and specify the language, it gets "painted" with keywords and so on, but in this case it becomes an image.
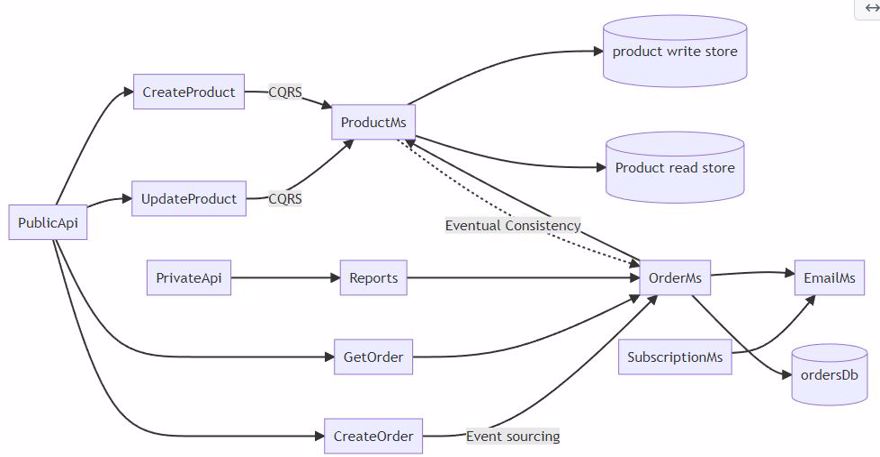
For example, with the following code:
```mermaid
graph LR;
 orderDb[(ordersDb)]
 productWriteDb[(product write store)]
 productReadDb[(Product read store)]
 PublicApi-->CreateProduct;
 PublicApi-->UpdateProduct;
 PublicApi--> CreateOrder;
 PublicApi-->GetOrder;
 UpdateProduct-->|CQRS| ProductMs;
 CreateProduct-->|CQRS| ProductMs;
 SubscriptionMs-->EmailMs;
 CreateOrder-->|Event sourcing|OrderMs;
 GetOrder-->OrderMs;
 OrderMs-->ProductMs;
 OrderMs-->EmailMs;
 PrivateApi-->Reports;
 Reports-->OrderMs;
 ProductMs-.->|Eventual Consistency|OrderMs;
 OrderMs-->orderDb;
 ProductMs-->productWriteDb;
 ProductMs-->productReadDb;
We will get the following diagram:
2 - Create maps on GitHub
We can use geojson or topojson to create maps and within these maps highlight areas, include the typical point indicating a place, etc.
To do this, just like before, we must include either topojson or geojson as the syntax identifier in our markdown file
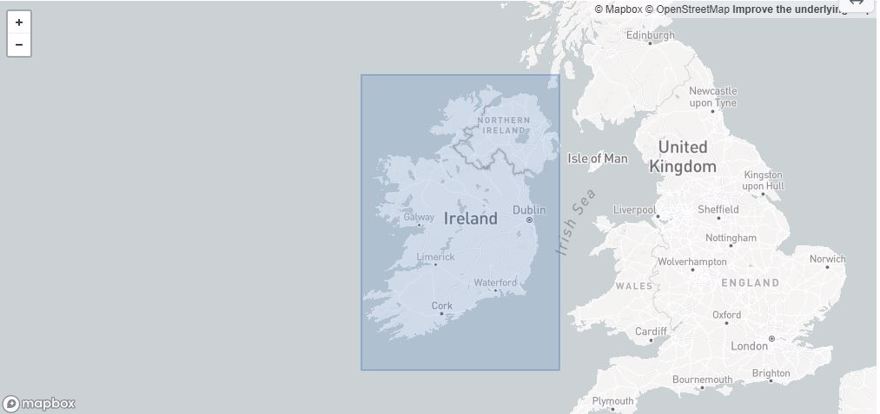
This is an example with geojson:
```geojson { "type": "FeatureCollection", "features": [ { "type": "Feature", "id": 1, "properties": { "ID": 0 }, "geometry": { "type": "Polygon", "coordinates": [ [ [-5.5,55.5], [-10.5,55.5], [-10.5,51], [-5.5,51], [-5.5,55.5] ] ] } } ] } ```Which gives us Ireland:
As we can see, this only generates a square, but we have more complex ones, as complex as we want. In the codeforgermany/click_that_hood repository we can find detailed maps of each country:
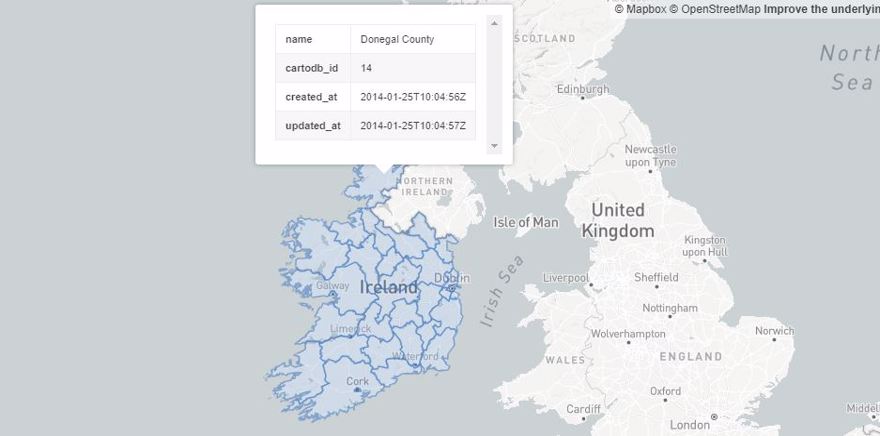
- Note: the maps are interactive.
3 - Create 3D models on GitHub
Finally, the last of GitHub's improvements for diagrams is the possibility of creating 3D objects inside markdown files. To do this we will use the stl syntax identifier.
```stl solid cube_corner facet normal 0.0 -1.0 0.0 outer loop vertex 0.0 0.0 0.0 vertex 1.0 0.0 0.0 vertex 0.0 0.0 1.0 endloop endfacet facet normal 0.0 0.0 -1.0 outer loop vertex 0.0 0.0 0.0 vertex 0.0 1.0 0.0 vertex 1.0 0.0 0.0 endloop endfacet facet normal -1.0 0.0 0.0 outer loop vertex 0.0 0.0 0.0 vertex 0.0 0.0 1.0 vertex 0.0 1.0 0.0 endloop endfacet facet normal 0.577 0.577 0.577 outer loop vertex 1.0 0.0 0.0 vertex 0.0 1.0 0.0 vertex 0.0 0.0 1.0 endloop endfacet endsolid ```With the following result:

If you access the repository, you will be able to see that the area where the triangle is located is interactive and we can rotate it to view it from different perspectives, etc.