Throughout the Distribt course, we have seen that we will create microservices to perform different actions within a larger system.
In the post about the SAGA pattern, we saw how a simple transaction in the monolithic world became a much more complex one within microservices. I mentioned how important it is to have a clear idea of everything that has happened, and when it happened, in our system.
Table of Contents
1 - Observability of our distributed system
As I just mentioned, it is important to know when and how an event occurred in our system. There are three ways to do this.
- Logs: which will tell us the specific error or the specific event we're indicating. We saw a post about them a while back.
- Metrics: Which tell us the raw statistics about the system. For example, a metric is the load time of a particular page on our website or how many times it has been loaded.
- Traces: The context of why things happen. The path of an action throughout our system, from start to finish. If we use the example of the order creation saga, each event will have a property called "traceId" and if there is an error we only need to search for the ID in our monitoring system to find all related events.
2 - What is OpenTelemetry?
When we have a distributed system, we have multiple applications, and these applications can all be written in the same programming language or in different languages.
When building systems, it is crucial to have data metrics so we can detect issues before the user notices the system is slow or something is failing.
Before OpenTelemetry arrived, each language generated metrics differently and each service you used required the data in a different format. For example, New Relic wanted the data in format A, and Prometheus wanted it in format B, etc.
This caused several problems, like having to implement the same thing multiple times or being unable to switch from one provider to another, because you had to rewrite everything from scratch.
This is where OpenTelemetry comes in, it standardizes the way applications send metrics, so regardless of the language your application is written in, the metric information will be generated in the same way.
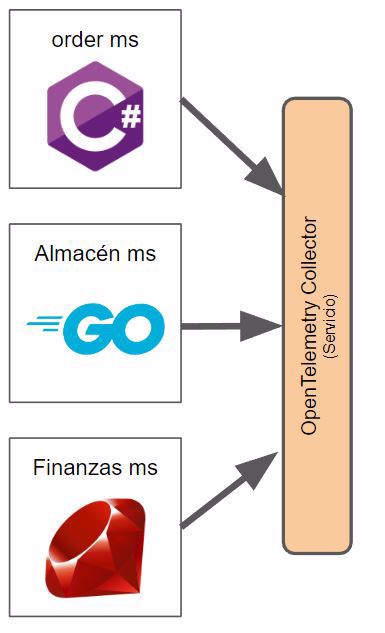
As you can see in the image, we have an element called the OpenTelemetry collector, which is basically the service that will collect, process, and display this data, since OpenTelemetry is not a backend application but a standard that provides APIs and SDKs in different languages as well as ways to export the information.
By the way, it's not in the image, but a virtual machine, CI/CD pipeline, or other services in your infrastructure can also generate metrics.
2.1 - OpenTelemetry Collector
What we call the OpenTelemetry Collector is an application or service that we will deploy alongside our applications, so those applications can send metric data to this service.
We have two ways to deploy the collector:
- Agent: when you deploy the application, you must run another service alongside it, on the same host. This is usually done with a sidecar if you use k8s or a daemonset, etc.
- Gateway: the collector is deployed as yet another regular service.
You can find more information on the official website.
- Note: in our example, we will see it deployed in Docker as a service.
3 - Visualizing metrics
Until now, we're only exporting the information but not actually doing anything with it. We need to process and store it to then visualize it, and this is where Prometheus, Grafana, and Zipkin come in. However, you can use whichever services you like or have available from your cloud provider; the idea remains the same.
3.1 - What is Prometheus?
The first thing we need is a backend to store and process the data, a database, essentially.
This is where Prometheus comes in, a database that acts as storage for our monitoring and metrics systems.
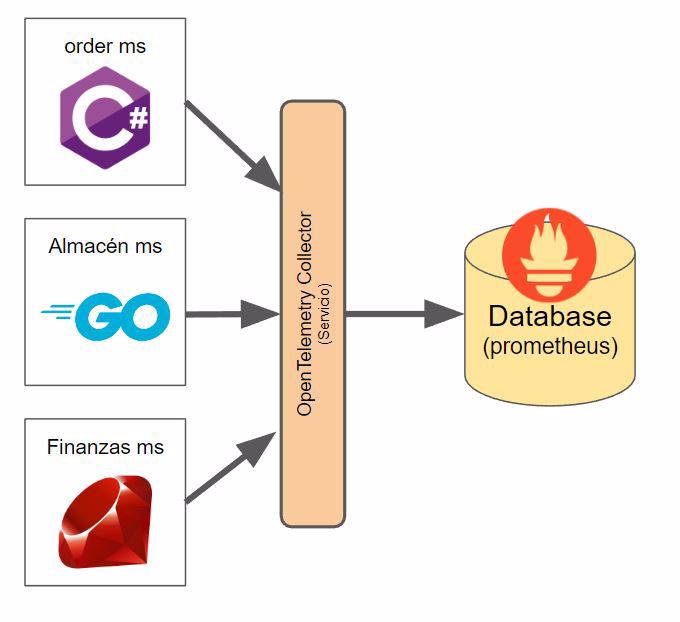
And honestly, its interface is nothing fancy, kind of ugly:
Note: We can send the data directly from the application to Prometheus without going through OpenTelemetry, as always, it will depend on the infrastructure you want to implement.
3.2 - What is Grafana?
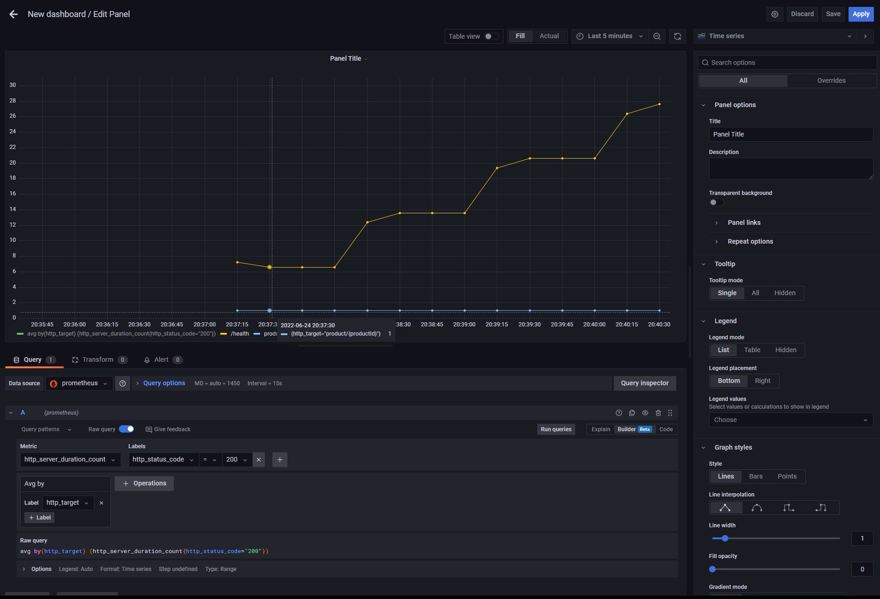
Once the information is stored and processed, we'll want to visualize it, but not just flat, we want cool charts and tables. That's where Grafana comes in, it's the user interface that will let us see the metrics.
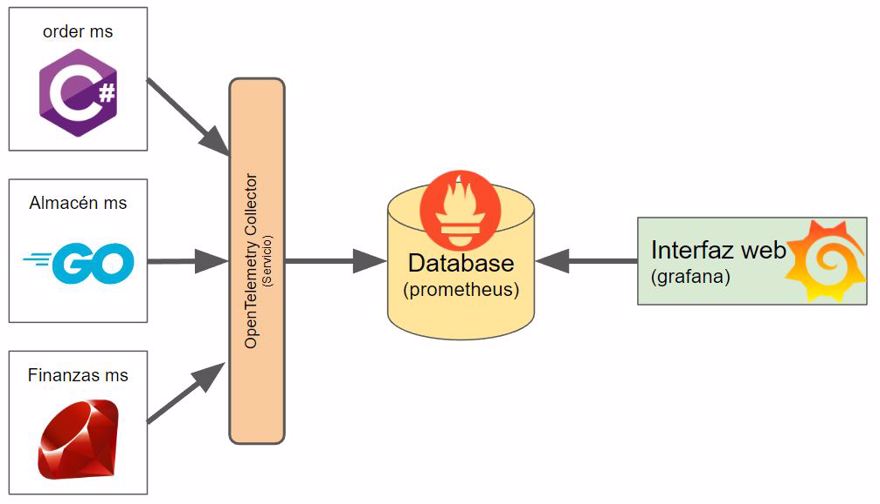
As you can see, I'm really not good at making charts, but well, the data is there to make some nice graphs.
3.3 - What is Zipkin?
Just as Grafana gives us charts and diagrams about our system or application metrics, Zipkin allows us to view traceability of calls, where each call goes and at what point it takes more or less time.
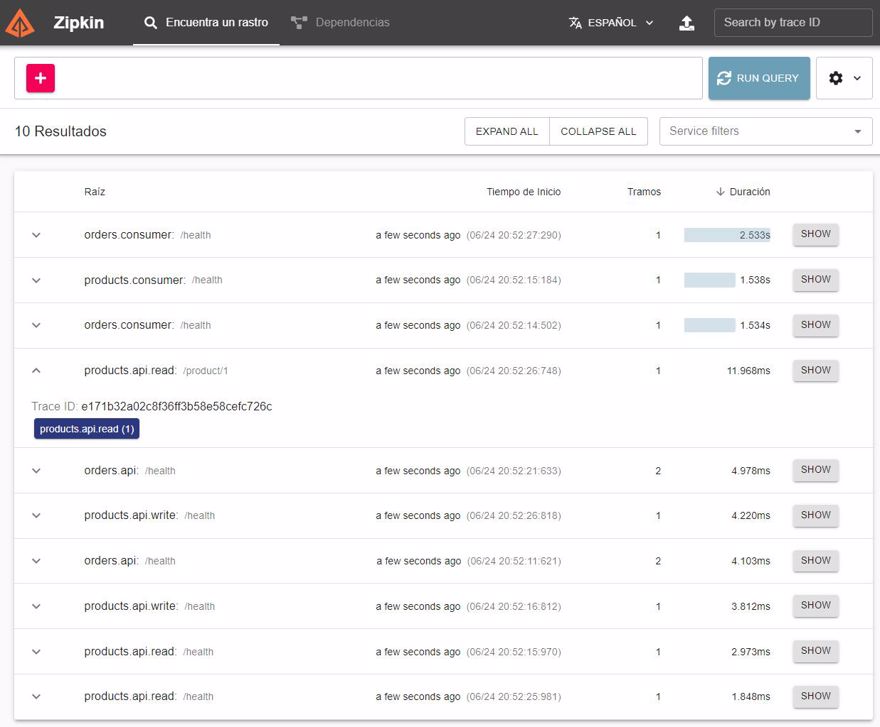
NOTE: In this post, I'm not going to show how to add custom traces or custom metrics, as that's outside the scope of this post and would be too long. I will show those actions in future, separate posts.
4 - Do we need OpenTelemetry?
Now that I have explained that OpenTelemetry is a standard and that the real work of storing, processing, and displaying data is done by Prometheus and Grafana (or other services), the question is clear.
Should we implement OpenTelemetry in our services?
Well, it depends, as always, there are pros and cons.
One advantage is if we switch providers, for example migrating from Prometheus and Grafana to New Relic, we won't have to change the code.
But at the same time, New Relic can understand Prometheus output. This means if you export to Prometheus and switch to New Relic, you also don’t need to change anything.
- Note: I'm not sure about other services, these are the ones I have experience with.
A drawback is that for OpenTelemetry to work, we need to have our service/sidecar configured, which means extra work, both in maintaining the service and in the system resources we have to allocate.
So we have two options: go the "fast" way, where we send logs from the application to the backend system (Prometheus), or go through an intermediary to normalize the data (OpenTelemetry)?
As always, it comes down to the resources you want to invest.
5 - Configuring OpenTelemetry in .NET
For this example, I'll use OpenTelemetry, which means our applications will use the OpenTelemetry Collector and Prometheus will connect to it to read and process that information.
5.1 - Creating the infrastructure for observability
The first thing we'll do is create all the configuration we need in our system, for that we'll go to our docker compose file and add the containers for OpenTelemetry, Prometheus, Grafana, and Zipkin
opentelemetry-collector:
  image: otel/opentelemetry-collector:latest
  container_name: open_telemetry_collector
  command: [ "--config=/etc/otel-collector-config.yaml" ]
  volumes:
    - ./tools/telemetry/otel-collector-config.yaml:/etc/otel-collector-config.yaml
    - ./tools/telemetry/logs:/etc/output:rw # Store the logs (not commited in git)
  ports:
    - "8888:8888"   # Prometheus metrics exposed by the collector
    - "8889:8889"   # Prometheus exporter metrics
    - "4317:4317"   # OTLP gRPC receiver
prometheus:
  image: bitnami/prometheus
  container_name: prometheus
  volumes:
    - ./tools/telemetry/prometheus.yaml:/etc/prometheus/prometheus.yml
  ports:
    - 9090:9090
grafana:
  image: grafana/grafana
  container_name: grafana
  environment:
    - GF_SECURITY_ADMIN_USER=admin
    - GF_SECURITY_ADMIN_PASSWORD=admin
    - GF_USERS_ALLOW_SIGN_UP=false
  volumes:
    - ./tools/telemetry/grafana_datasources.yaml:/etc/grafana/provisioning/datasources/all.yaml
  ports:
    - 3000:3000
zipkin:
  container_name: zipkin-traces
  image: openzipkin/zipkin:latest
  ports:
    - "9411:9411"
As you can see, inside the OpenTelemetry container we are using a configuration file called otel-collector-config.yaml, which contains the configuration, available protocols, and where the collected information is exported:
# https://github.com/open-telemetry/opentelemetry-collector-contrib/tree/main/receiver
receivers:
  otlp:
    protocols:
      grpc:

# Configure exporters
exporters:
  # Export prometheus endpoint
  prometheus:
    endpoint: "0.0.0.0:8889"

  # log to the console
  logging:

  # Export to zipkin
  zipkin:
    endpoint: "http://zipkin:9411/api/v2/spans"
    format: proto

  # Export to a file
  file:
    path: /etc/output/logs.json

# https://opentelemetry.io/docs/collector/configuration/#processors
processors:
  batch:

# https://opentelemetry.io/docs/collector/configuration/#service
# https://github.com/open-telemetry/opentelemetry-collector/blob/main/docs/design.md#pipelines
service:
  pipelines:
    traces:
      receivers: [otlp]
      processors: [batch]
      exporters: [logging, zipkin]
    metrics:
      receivers: [otlp]
      processors: [batch]
      exporters: [logging, prometheus]
    logs:
      receivers: [otlp]
      processors: []
      exporters: [logging, file]
This is the prometheus one (prometheus.yaml), you can see we're telling it to query the opentelemetry container to receive the data
scrape_configs:
  - job_name: 'collect-metrics'
    scrape_interval: 10s
    static_configs:
      - targets: ['opentelemetry-collector:8889']
      - targets: ['opentelemetry-collector:8888']
And finally the grafana one where we indicate Prometheus as a data source and its location:
datasources:
  - name: 'prometheus'
    type: 'prometheus'
    access: 'proxy'
url: 'http://prometheus:9090'- Note: the username and password to connect to grafana is
admin:admin
And now we can run docker-compose up to launch our infrastructure ..
5.2 - Implementing OpenTelemetry in C# code
The first thing we have to do is add the following packages:
- OpenTelemetry.Exporter.OpenTelemetryProtocol
- OpenTelemetry.Extensions.Hosting (prerelease)
- OpenTelemetry.Instrumentation.AspNetCore (prerelease)
If instead of the Exporter.OpenTelemetryProtocol package, we install the Exporter.Prometheus package, we can send information directly to Prometheus without going through the collector.
- Note: If you are in the Distribt project, this package is added within the
Distribt.Shared.Setupproject, which means all our applications will have OpenTelemetry implemented by default.
With these packages we can include tracing, metrics, and logs.
5.2.1 - Add Tracing to a .NET application with OpenTelemetry
We only need to use the AddOpenTelemetryTracing() method and pass in the necessary configuration via the builder.
public static void AddTracing(this IServiceCollection serviceCollection, IConfiguration configuration)
{
    serviceCollection.AddOpenTelemetryTracing(builder => builder
        .SetResourceBuilder(ResourceBuilder.CreateDefault().AddService(configuration["AppName"]))
        .AddAspNetCoreInstrumentation()
        .AddOtlpExporter(exporter =>
        {
            //TODO: call the discovery service to retrieve the correctUrl dinamically
            exporter.Endpoint = new Uri("http://localhost:4317");
        })
    );;
}
As you can see, we're passing a name for the service, which will be configured in each of our application's appsettings.json files.
5.2.2 - Add Metrics to a .NET application with OpenTelemetry
Similar to the previous case, we need to use the .AddOpenTelemetryMetrics() method:
public static void AddMetrics(this IServiceCollection serviceCollection, IConfiguration configuration)
{
    serviceCollection.AddOpenTelemetryMetrics(builder => builder
        // Configure the resource attribute `service.name` to MyServiceName
        .SetResourceBuilder(ResourceBuilder.CreateDefault().AddService("MyServiceName"))
        // Add metrics from the AspNetCore instrumentation library
        .AddAspNetCoreInstrumentation()
        .AddOtlpExporter(exporter =>
        {
            //TODO: call the discovery service to retrieve the correctUrl dinamically
            exporter.Endpoint = new Uri("http://localhost:4317");
        }));
}
5.2.3 - Add Logs to a .NET application with OpenTelemetry
Similar to before, use the .ConfigureLogging() method:
public static void AddLogging(this IHostBuilder builder, IConfiguration configuration)
{
    builder.ConfigureLogging(logging => logging
            //Next line optional to remove other providers
            .ClearProviders()
            .AddOpenTelemetry(options =>
            {
                options.IncludeFormattedMessage = true;
                options.SetResourceBuilder(ResourceBuilder.CreateDefault().AddService(configuration["AppName"]));
                options.AddConsoleExporter();
            }));
}
In the Distribt library, this is more optional since we saw how to configure the application to use graylog.
And that's it, if we launch the applications, we can see the result. The images you saw throughout this post are taken from the actual result.
6 - Adding observability to other parts of our infrastructure
We can add observability to many parts of our infrastructure, or even all of them. If you use cloud services, these already come with observability, traces, etc. out of the box, so there’s nothing to configure, they’re just available by default.
6.1 - Connecting RabbitMQ with Prometheus and Grafana
In another post in the distributed systems course, we discussed what a service bus is, specifically RabbitMQ, now we're going to see how to add information to Prometheus/Grafana.
The first thing we need to do is, in our infrastructure, modify the service in the docker-compose file to indicate that we will pass a file called enabled_plugins via the volumes:
rabbitmq:
  image: rabbitmq:3.8.34-management-alpine #management version needed to be able to have a User interface
  container_name: rabbitmq
  ports:
      - 5672:5672
      - 15672:15672
  volumes:
      - ./tools/rabbitmq/rabbitmq.conf:/etc/rabbitmq/rabbitmq.conf
      - ./tools/rabbitmq/definitions.json:/etc/rabbitmq/definitions.json
      - ./tools/rabbitmq/enabled_plugins:/etc/rabbitmq/enabled_plugins
This file contains a list of plugins we're going to enable in RabbitMQ, in this case, the one we're interested in is rabbitmq_prometheus but I have enabled a few others.
[rabbitmq_prometheus, rabbitmq_amqp1_0, rabbitmq_management, rabbitmq_web_dispatch, rabbitmq_management_agent, rabbitmq_stomp].
And finally, modify our prometheus.yaml file to add the new target to collect the information.
scrape_configs:
  - job_name: 'collect-metrics'
    scrape_interval: 10s
    static_configs:
      - targets: ['opentelemetry-collector:8889']
      - targets: ['opentelemetry-collector:8888']
      - targets: [ 'rabbitmq:15692' ]
And now we can run docker-compose up -d.
Once it's running, you'll need to do a manual step, remember, this only needs to be done once in production.
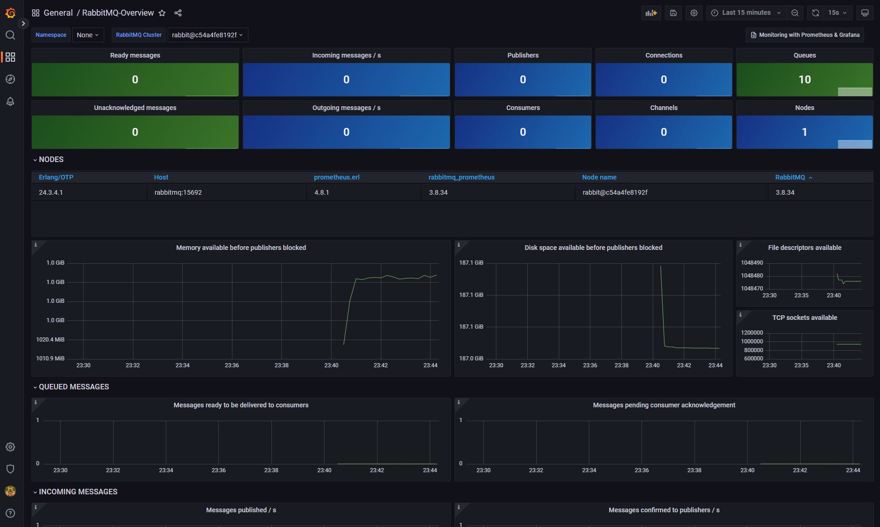
We need to import the dashboard from the official page in Grafana. This is because Grafana itself has a large community sharing dashboards.
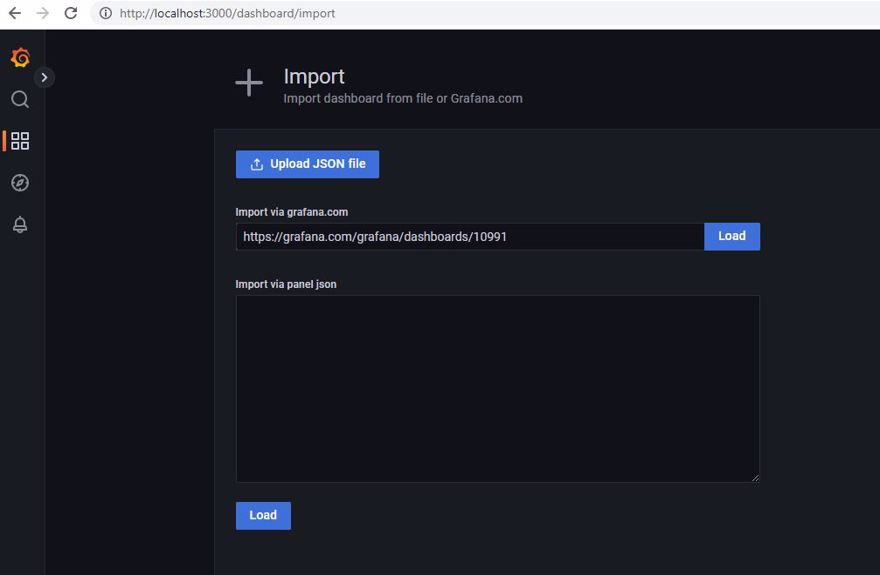
When importing, make sure you have changed the datasource to Prometheus, as it is the one with the information available.
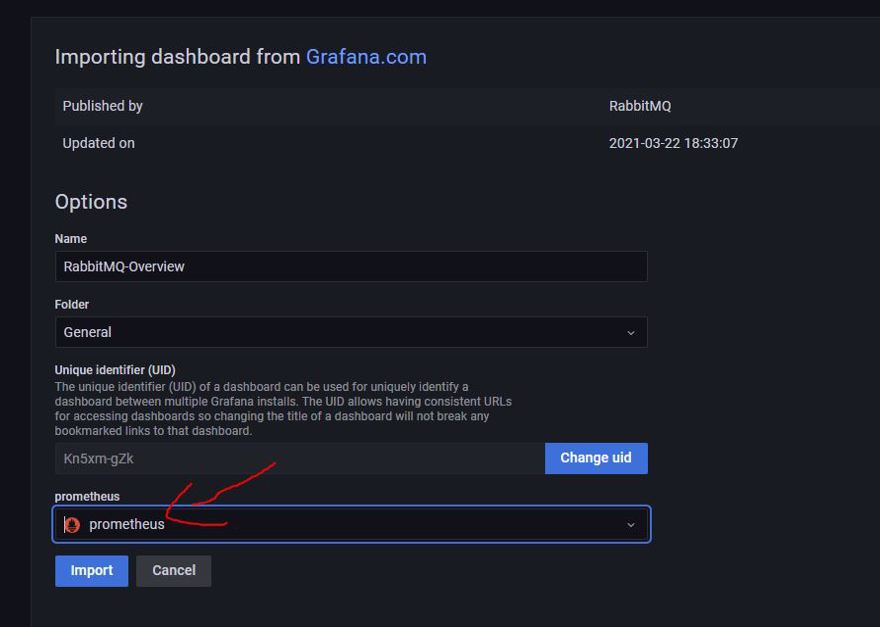
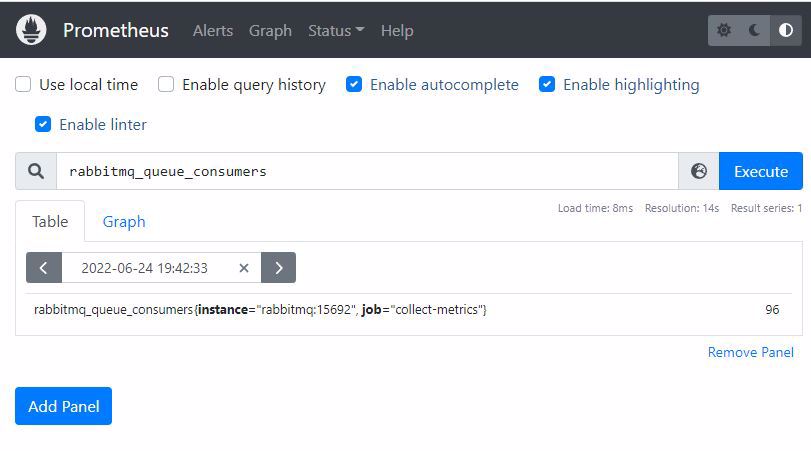
And this is the final result, as we can see in the upper corner, it shows the number of queues available in RabbitMQ.
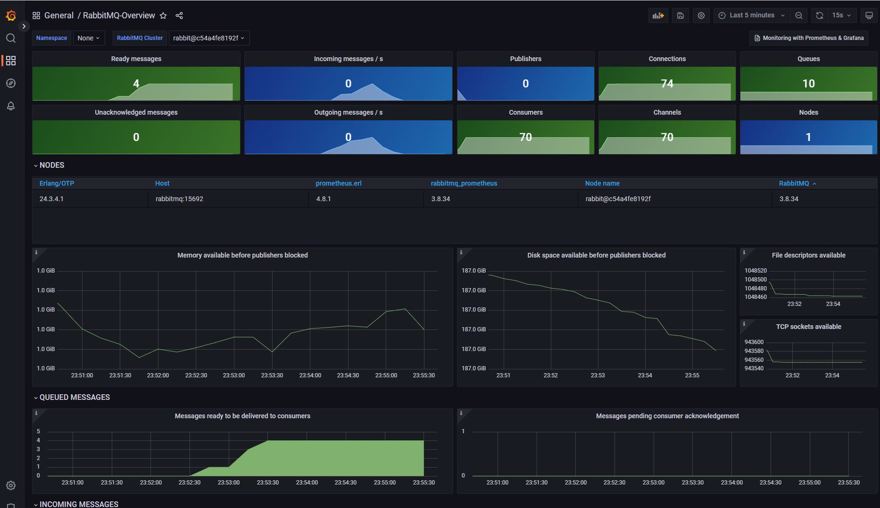
And if we run the applications and generate some events, we can see how the rest of the charts also change:
Conclusion
In this post, we have seen what opentelemetry is and how it fits into observability.
How to use OpenTelemetry with .NET and Prometheus.
How to use Prometheus with Grafana.
How to use Prometheus with Zipkin.
How to add observability to other parts of our infrastructure.